SmtC: Show me the Code
Ole Peter Smith
Instituto de Matemática e Estatística
Universidade Federal de Goiás
http://www.olesmith.com.br

$\LaTeX$ V: TikZ
E se Eva tinha optado pela cobra?
Facebook.

Plot Curves: Package pgfplots

\documentclass{standalone}
\usepackage{pgfplots}
\begin{document}\begin{tikzpicture}
   \draw[variable=\x,domain=-1:1] plot ({\x},{    -\x*\x+1  });
   %...
\end{tikzpicture}
  1. \draw [variable=\y,samples=50,domain=0.2:4] plot ({2/\y}, {\y});
  2. %No \ on functions like sqrt, cos, sin,...!
  3. \draw [variable=\x,samples=50,domain=0.2:4] plot (   { \x }, { sqrt(\x) }   );
  4. %Cycloid
    \pgfmathparse{2} \let\r\pgfmathresult
    \draw [variable=\t,samples=50,domain=0:2*pi] plot (   { \r*(\t-sin(\t) }, { \r*(1-cos(\t) }   );
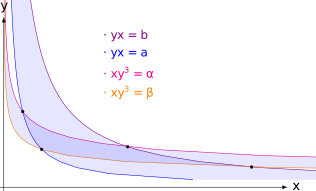
\[ a \leq xy \leq b \wedge \alpha \leq xy^3 \leq \beta \]
TiKZ Listing: Fig.tikz.tex. PDF   PNG   SVG   ZIP*  
\documentclass{standalone}

\usepackage{tikz}
\usepackage{pgfplots}

\usetikzlibrary
{
   intersections,
   pgfplots.fillbetween
}


\begin{document}
\begin{tikzpicture}
   %Clipping area
   \tikzmath{\xr=7.5;}
   \tikzmath{\yt=4.5;}
   \tikzmath{\xl=-0.1;}
   \tikzmath{\yb=-0.1;}
   %Clip!
   \clip (\xl,\yb) rectangle (1.1*\xr,1.1*\yt);
   

   \tikzmath{\a=1;}
   \tikzmath{\b=3.5;}
   \tikzmath{\Alpha=1;}
   \tikzmath{\Beta=4;}

   \tikzmath{\YB=0.2;}
   \tikzmath{\YT=8;}
   
   \tikzstyle{curves}=[variable=\y,samples=50,domain=\YB:\YT]

   %xy=a
   \draw [color=blue,name path=a,curves] 
      plot ({\a/\y}, {\y});
   %xy=b
   \draw [color=violet,name path=b,curves]
      plot ({\b/\y}, {\y});

   %xy^3=\alpha
   \draw [color=orange,name path=alpha,curves]
      plot ({\Alpha/(\y*\y*\y)}, {\y});
      
   %xy^3=\beta
   \draw [color=magenta,name path=beta, curves] 
      plot ({\Beta/(\y*\y*\y)},  {\y});
      
   %Curve titles
   \tikzstyle{texts}=[right,font={\small}]

   \tikzmath{\x=2.5;}
   \tikzmath{\y=2.5;}
   \tikzmath{\dy=0.5;}
   \node[texts,color=orange]  at (\x,\y+0*\dy) {$\cdot~xy^3=\beta$};
   \node[texts,color=magenta] at (\x,\y+1*\dy) {$\cdot~xy^3=\alpha$};
   \node[texts,color=blue]    at (\x,\y+2*\dy) {$\cdot~yx=a$};
   \node[texts,color=violet]  at (\x,\y+3*\dy) {$\cdot~yx=b$};
   

   \tikzfillbetween[of=a and b]{blue, opacity=0.1};
   \tikzfillbetween[of=alpha and beta]{blue, opacity=0.1};

   %Intersections
   \foreach \t in {\a,\b} {
     \tikzmath{\y=sqrt(\Alpha/\t);};
     \tikzmath{\x=sqrt(\t*\t*\t/\Alpha);};
     \filldraw (\x,\y) circle(1pt);
   }
   
   %Intersections
   \foreach \t in {\a,\b} {
     \tikzmath{\y=sqrt(\Beta/\t);};
     \tikzmath{\x=sqrt(\t*\t*\t/\Beta);};
     \filldraw (\x,\y) circle(1pt);
   }
   
   %Coordinate system
   \draw [-latex] (\xl,0) -- (\xr,0) node [right] {$x$};
   \draw [-latex] (0,\yb) -- (0,\yt) node [above] {$y$};
   
\end{tikzpicture}
\end{document}

Image in PNG
Messages:
0 secs.