|
SmtC: Show me the Code
Ole Peter Smith
Instituto de Matemática e Estatística
Universidade Federal de Goiás
http://www.olesmith.com.br
|
|
A seriedade dos acontecimentos da minha época.
Me enche de esperança.
Karl Marx
|
Plot Curves: Package pgfplots
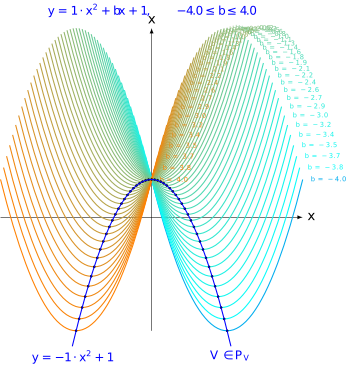
Parabolas,
Vertex:
Observe:
.
\documentclass[]{standalone}
\usepackage{tikz}
\usepackage{pgfplots}
\usetikzlibrary{calc}
\pgfplotsset{compat=1.14}
\usepackage{numprint}
\usepackage{xcolor}
%Draw Parabolas: y=ax^2+bx+c
%a,c fixed, b varying
\begin{document}
\begin{tikzpicture}
\tikzstyle{texts}=[below,font={\small},blue]
\tikzmath{\a=1;}
\tikzmath{\c=1;}
\tikzmath{\bfirst=-4.0;}
\tikzmath{\blast= 4.0;}
\tikzmath{\N=50;}
\tikzmath{\dx=2;}
%Variation of colors - color in [0,100].
\tikzmath{\dn=100/\N;}
%Steps of b
\tikzmath{\db=(\blast-\bfirst)/\N;}
%Coordinate system
\draw[-latex] (-4,0) -- (4,0) node [right] {$x$};
\draw[-latex] (0,-3) -- (0,5) node [above] {$y$};
%Vertex Parabola title
\tikzmath{\x=2.1;}
\coordinate (V) at ({-\x},{ -\a*\x*\x+\c });
\node[texts] at (V) {$y=-\a \cdot x^2+\c$};
\coordinate (V) at ({\x},{ -\a*\x*\x+\c });
\node[texts] at (V) {$V \in \mathcal{P}_V$};
%Figure title
\node[texts] at (0,5.75)
{$y=\a \cdot x^2+b x+\c, \qquad \bfirst \leq b \leq \blast$};
\foreach \n in {0,1,...,\N}
{
%\b and color, \color
\tikzmath{\b=\bfirst+\n*\db;}
\tikzmath{\color=\n*\dn;}
%Discriminante
\tikzmath{\d=\b*\b-4*\a*\c;}
%Symmetrical value
\tikzmath{\bb=-0.5*\b/\a;}
%Interval to draw, symmetrical around \bb
\tikzmath{\xlower=\bb-\dx;}
\tikzmath{\xupper=\bb+\dx;}
\draw
[
thick,smooth,
domain=\xlower:\xupper,
variable=\x,
%Convex combination of colors
color=orange!\color!cyan
]
plot ({\x},{ \a*\x*\x+\b*\x+\c })
%node[right]
%{\tiny{
% $b=$ %round to 1 decimal
% \nprounddigits{1}\numprint{\b}
%}}
;
}
\foreach \n in {0,1,...,\N}
{
%\b and color, \color
\tikzmath{\b=\bfirst+\n*\db;}
\tikzmath{\color=\n*\dn;}
%Discriminante
\tikzmath{\d=\b*\b-4*\a*\c;}
%Symmetry value
\tikzmath{\bb=-0.5*\b/\a;}
%Vertex
\coordinate[gray] (V) at ($( \bb, -0.25*\d/\a )$);
\filldraw (V) circle(0.75pt);
}
%Vertex Parabola
\draw
[
thick,smooth,
domain=-2.1:2.1,
variable=\x,
color=blue
]
plot ({\x},{ -\a*\x*\x+\c });
\end{tikzpicture}
\end{document}
|
|
Messages:
0 secs.
|